You will leave this section with an ability to sketch a phase diagram and/or interpret a given phase diagram.
Synopsis
A phase diagram is a P vs. T diagram for a substance that shows "all" the phases of the substance. I have "all" in quotation marks because whether all phases are really shown depends upon the sophistication of the phase diagram. For example, water has many more phases than are shown in Figure 13.17. One phase of ice, Ice VII, melts at 100 oC and 25,000 atm! You may learn more about phases of matter in more advanced courses.
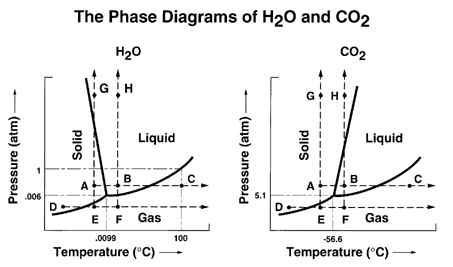
Ordinarily you will be working with just three phases: solid, liquid, and gas. Below are phase diagrams for carbon dioxide, and water.
The point where the solid, liquid, and gas states coexist simultaneously is called the triple point. Note the critical point, which is the upper limit of the liquid/vapor line. It is not known if the solid/liquid line has an upper limit. Note that for the first diagram the slope of the solid/liquid line is positive, but for water the slope is negative. Most substances behave as shown in the first diagram, but the unusual behavior of water is one of many ways that water is an unusual liquid. Some compounds, like sulfur, have more than one solid form and the phase diagrams have to show all of the forms.
From the phase diagram for CO2 on page 632 you see that CO2 sublimes at one atm pressure which is why it is called dry ice
Review Questions
1.) Sketch a phase diagram for a substance and show a T and P where sublimation can occur.
2.) Discuss on the WebCT bulletin board some practical applications of the negative slope of the solid/liquid curve for water.
3.) Use a phase diagram to indicate the supercritical state.

Web Author: Dr. Leon L. Combs
Copyright ©2000 by Dr. Leon L. Combs - ALL RIGHTS RESERVED